
Learning Graphs: A Strategic Approach to Computing Curriculum Planning
With the rapid evolution of technology and its increasing role in everyday life, ensuring that computing education is accessible, engaging, and strategically planned has become crucial. One groundbreaking initiative in this field is the comprehensive curriculum developed by the National Centre for Computing Education (NCCE), in collaboration with the Raspberry Pi Foundation.
Background: Why Learning Graphs?
Planning a robust computing curriculum is no small feat. To tackle the complexity, the NCCE has organised its content using a strategic framework known as learning graphs. These learning graphs help to structure and map the curriculum, ensuring a logical progression of concepts, skills, and knowledge. But what exactly are learning graphs, and why are they a game-changer for computing education?
What are Learning Graphs?
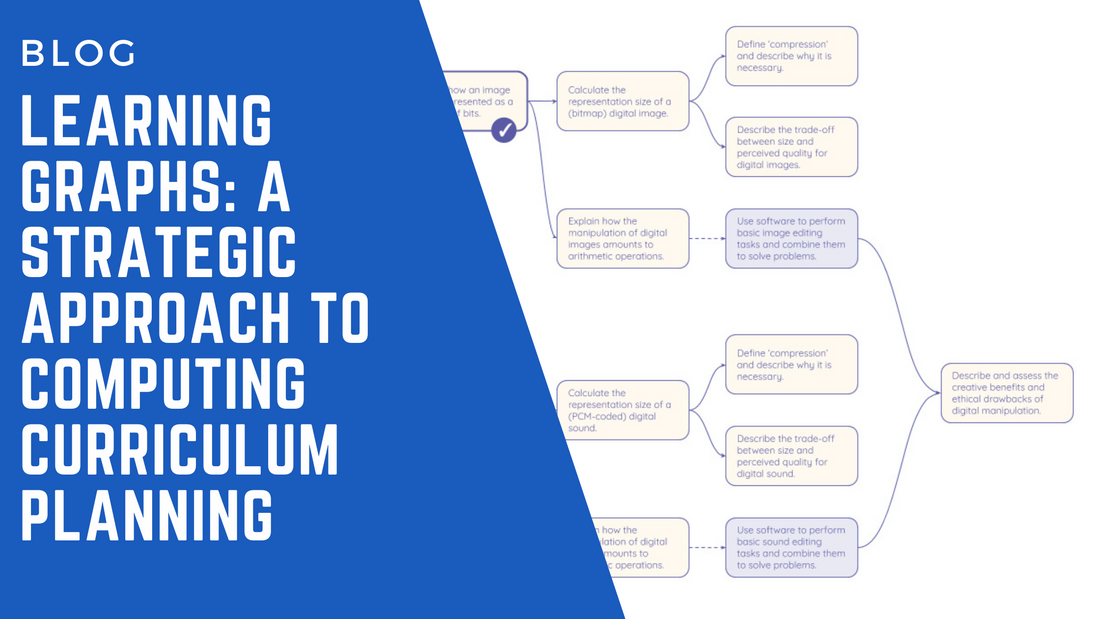
In simple terms, a learning graph is a visual representation that maps out the educational journey of a student. Think of it as a roadmap, where nodes (or waypoints) represent specific learning objectives, skills, or knowledge, and the connections between nodes illustrate the order in which these concepts should be mastered.
- Nodes: Each node corresponds to a particular learning objective, concept, or skill.
- Connections: Two nodes are linked if one concept is a prerequisite for the other. This means students need to understand the first concept before moving on to the next.
- Clusters: These nodes often form clusters, representing themes or units within the curriculum, making it easier to visualize the learning process.
By organizing curriculum content in this manner, learning graphs reveal the non-linear nature of learning and help educators plan lessons that cater to diverse learning paths.
Learning Graphs vs. Traditional Learning Maps
While there are other approaches to visualizing learner journeys—such as learning trajectories, learning maps, and learning progressions—learning graphs stand out for their focus on informing lesson planning. Learning graphs aren’t just a theoretical tool; they have a direct impact on the practical delivery of lessons in the classroom.
How Learning Graphs are Constructed
Creating a learning graph is a collaborative, iterative process that involves input from content developers, teachers, researchers, and academic advisors. Here’s a step-by-step breakdown of how learning graphs are constructed:
- Generate Nodes: Each node is created based on the learning objectives for a particular unit of lessons.
- Establish Relationships: Nodes are linked when they have a direct relationship, indicating that one concept must be understood before the next.
- Commit to a Specific Journey: The learning graph is then structured to reflect the chosen path for delivering the content.
- Identify Themes: Finally, nodes are grouped into themes, allowing teachers to see how different parts of the curriculum interrelate.
Benefits of Learning Graphs in Curriculum Planning
-
Revealing Non-Linear Structures
Learning is rarely a linear process. Learning graphs make it easier to visualize the complex pathways that students might take, highlighting multiple routes to mastering a concept. -
Critical Thinking in Curriculum Design
By mapping out relationships between different learning objectives, learning graphs encourage educators to think critically about the sequencing of lessons. This process often reveals gaps that need to be filled by adding intermediate nodes, or areas where additional reinforcement is needed. -
Consistency in Terminology
Because learning graphs require teams to agree on how to define and sequence each node, they help establish a consistent use of terminology across the curriculum. This ensures that the language used to describe concepts is uniform, reducing confusion for both teachers and students. -
Flexibility for Diverse Learning Journeys
Every student’s learning journey is unique. Learning graphs allow educators to adapt the curriculum to suit the needs of different learners, ensuring that no one is left behind.
Challenges in Implementing Learning Graphs
While learning graphs offer a powerful tool for curriculum planning, they also come with their own set of challenges:
-
Complexity in Structure
As more nodes are added to a learning graph, it can become large, complicated, and interwoven. This makes it challenging to structure and interpret the graph clearly, particularly for educators who are new to this approach. -
Need for Purpose-Built Tools
The NCCE found that working with learning graphs requires specialized software to efficiently manage and visualize complex relationships. Developing and maintaining these graphs manually can be time-consuming and prone to errors.
Future Directions: Enhancing Learning Graphs
The NCCE envisions several areas for future development to make learning graphs even more effective:
-
Integration with Assessment
Learning graphs could be used to design more meaningful assessments that directly reflect a student’s journey through the curriculum. This would enable educators to track progress more accurately and identify learning gaps. -
Pedagogical Insights
By analyzing the structure of learning graphs, educators could gain insights into the most effective teaching methods for different concepts, informing future pedagogical strategies. -
Combining with Concept Maps
Concept maps and learning graphs serve different purposes but can complement each other. Concept maps show relationships between concepts, while learning graphs show the sequence of learning. Combining the two could offer a more comprehensive view of a student’s learning journey. -
Teacher Feedback and Refinement
Continuous feedback from teachers is essential to refining learning graphs. By understanding how teachers use these graphs in real-world settings, the NCCE can make iterative improvements to ensure that they remain practical and effective tools.
Conclusion: A Strategic Approach to Computing Education
The use of learning graphs in curriculum planning marks a significant step forward in the way computing is taught. They provide a structured yet flexible framework that helps educators plan lessons more effectively, cater to diverse learning needs, and create a more inclusive learning environment.
With the support of organizations like the NCCE and the Raspberry Pi Foundation, learning graphs have the potential to transform computing education, making it more engaging, accessible, and impactful for learners everywhere. As this approach continues to evolve, it will play a crucial role in shaping the future of computing education.
Ready to explore the potential of learning graphs in your curriculum? Stay tuned for more updates and insights from the NCCE as we continue to refine and expand this innovative approach to teaching computing.
#CurriculumPlanning #STEMEducation #EdTech #LearningGraphs #NCCE #ComputingEducation #RaspberryPi #TeachingStrategies #EducationalInnovation